
Step 3: Restart Collector
To finish, restart the collector app:
heroku restart -a [your-collector-app-name]Afterwards, check the app logs again.
heroku logs -a [your-collector-app-name] -tIf the collector was able to match the log data to the correct database, you will see a log line like this after about a minute:
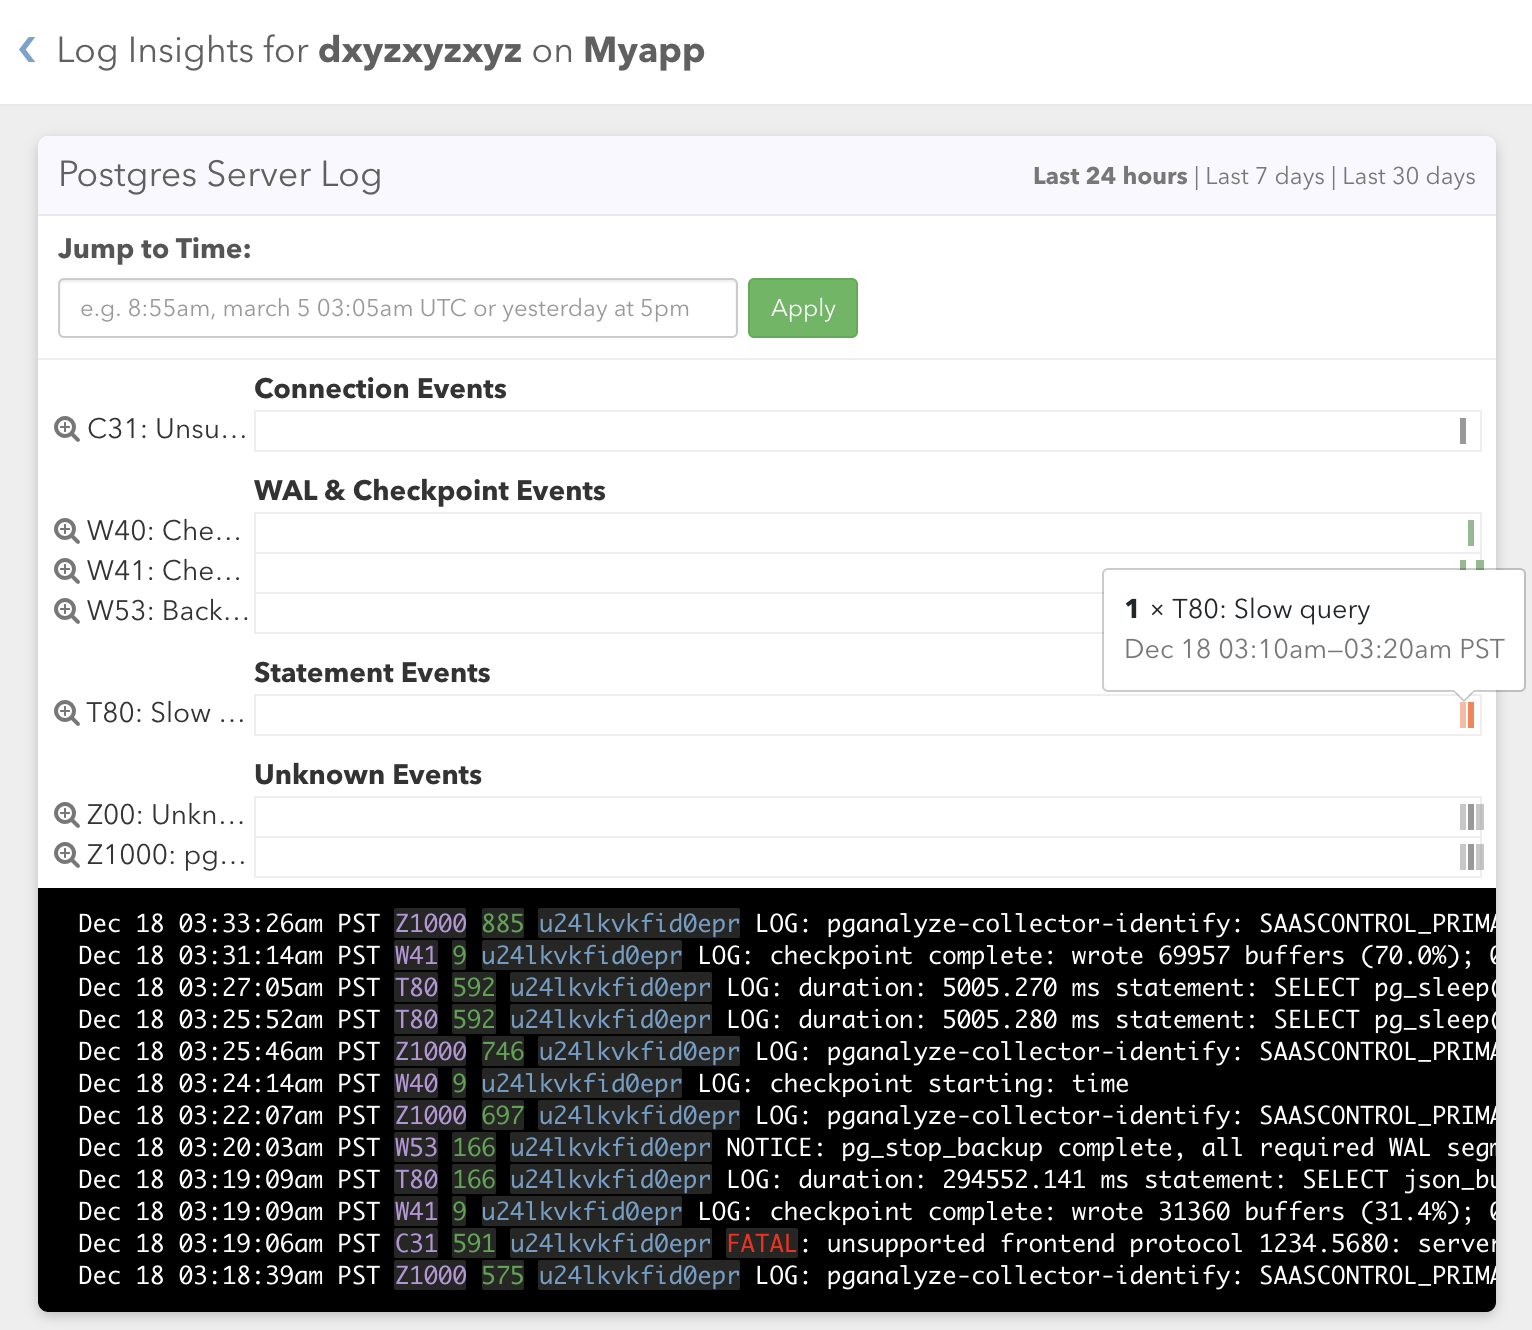
2018-05-20T21:22:19.854980+00:00 app[web.1]: I [TESTAPP_URL] Submitted compact snapshots successfully: 2 activity, 1 logsAnd then when you check the pganalyze interface, you will see Log Insights data:
Note that on Heroku Postgres you have limited configuration options, but you may want to review the defaults of:
log_min_duration_statement = 2000
log_lock_waits = on
log_statement = ddl
You can see details on what these settings do in our tuning guide.
Couldn't find what you were looking for or want to talk about something specific?
Start a conversation with us →